On social trading platforms like eToro, investors can copy the strategies of experienced traders. However, most users focus solely on profitability, ignoring the associated risk. This project addresses precisely that problem.
The problem
Social trading platforms highlight traders with the highest returns, but high returns don’t always mean low risk. To understand why, we need to talk about risk-adjusted metrics:
Sharpe Ratio: Measures the excess return obtained per unit of total volatility. A Sharpe of 2.0 means that for each point of risk assumed, 2 points of return are obtained. Values above 1.0 are considered good.
Sortino Ratio: Similar to Sharpe, but only penalizes downside volatility (losses), ignoring upward fluctuations. It’s more realistic for investors, since gains aren’t “risk”. A Sortino of 2.0+ is excellent.
Calmar Ratio: Compares annualized return with maximum historical drawdown. A Calmar of 1.0 means that if the trader earned 30% annually but had a maximum drawdown of 30%, their ratio is 1.0. Values above 3.0 indicate great resilience.
Beta: Measures a trader’s sensitivity relative to the market. In this project we use the S&P 500 index. A beta of 1.0 means it moves exactly like the S&P 500, 1.5 indicates 50% more volatility than the index, and 0.5 indicates half. Low values (< 1.0) suggest defensive or market-neutral strategies.
Same return, opposite risks
With these concepts clear, let’s look at two traders with 30% annual return:
- Trader A: Consistent gains, Sharpe 2.0 and Sortino 2.5 (low risk)
- Trader B: Volatile year, Sharpe 0.5 and Sortino 0.4 (high risk)
The investor’s experience will be radically different: while Trader A allows you to stay calm during moderate fluctuations, with Trader B there’s a risk of panic selling during a 60% drop.
The solution
I’ve developed an analysis platform that provides:
- Risk-adjusted metrics (Sharpe, Sortino, Calmar) for comprehensive evaluation
- Portfolio diversification analysis (sectors, exchanges, countries)
- Elite trader identification based on sustainable performance criteria
- Data-driven insights that replace emotional decisions
Methodology and dataset
The analysis was performed on a dataset collected over 6 months. The data is updated daily in small subsets prioritizing those that haven’t been updated longest:
Dataset characteristics:
- 1,500 traders analyzed with complete metrics history
- Collection period: June 29 - December 11, 2025
- 21 variables per trader including risk metrics, portfolio composition, and market data.
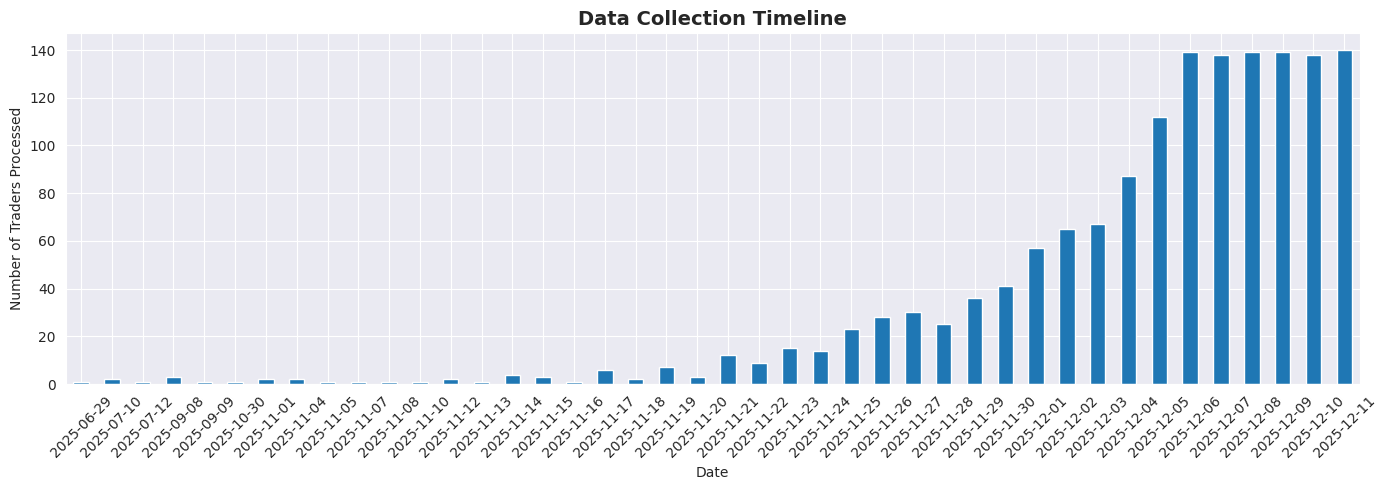
Figure 1: Data collection timeline showing the number of traders last updated
Return distribution
The analysis of annualized returns reveals an interesting distribution:
Key statistics:
- Mean: 15.60% annual
- Median: 15.09% annual
- Standard deviation: 21.37%
- 75th percentile: 23.80% annual
- 90th percentile: 34.80% annual
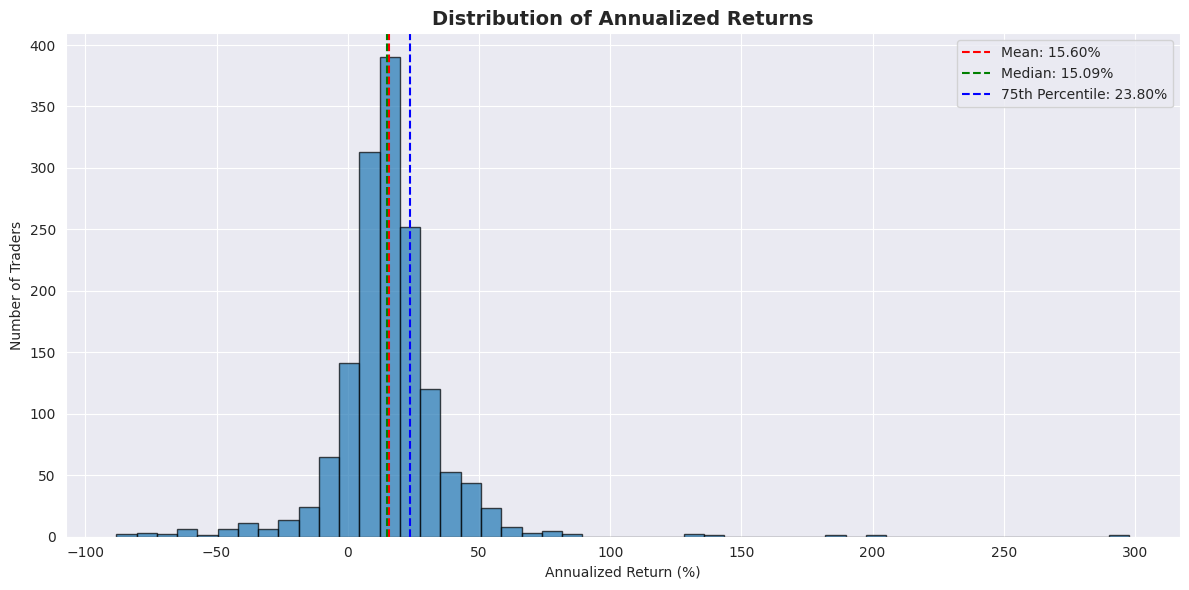
Figure 2: Distribution of annualized returns. Most traders concentrate between 0-25%, with a long tail toward extraordinary returns
The distribution shows a significant concentration around the mean, with approximately 800 traders (53%) grouped in the 0-25% annual return range. However, the extended right tail reveals exceptional traders with returns above 100% annually, though these cases require especially careful analysis of the risk assumed.
Technical architecture
The project implements a Medallion architecture (Bronze → Silver → Gold) in Databricks:
Bronze (Raw data):
- Immutable HTML responses from trader profiles
- Append-only pattern allowing complete reprocessing
- HTTP status code handling for debugging
Silver (Curated data):
- Parsed and validated risk metrics
- Portfolio composition in normalized format
- Data quality guaranteed through validations
Gold (Analytics):
- Elite traders (Sortino > 7 AND Calmar > 7)
- Top performers by annualized return
- Data ready for recommendation systems
Analysis of top 25% performers
Examining the upper quartile of traders (375 of the 1,500 analyzed), we find risk profiles significantly different from the average:
Risk metrics of top 25%:
| Metric | Mean | Median | Q1 | Q3 | Maximum |
|---|---|---|---|---|---|
| Sharpe Ratio | 1.05 | 0.94 | 0.77 | 1.21 | 3.80 |
| Sortino Ratio | 2.43 | 2.00 | 1.58 | 2.77 | 10.00 |
| Calmar Ratio | 1.77 | 1.02 | 0.61 | 2.23 | 10.00 |
| Beta | 1.21 | 1.12 | 0.88 | 1.46 | 3.30 |
Risk-return visualization
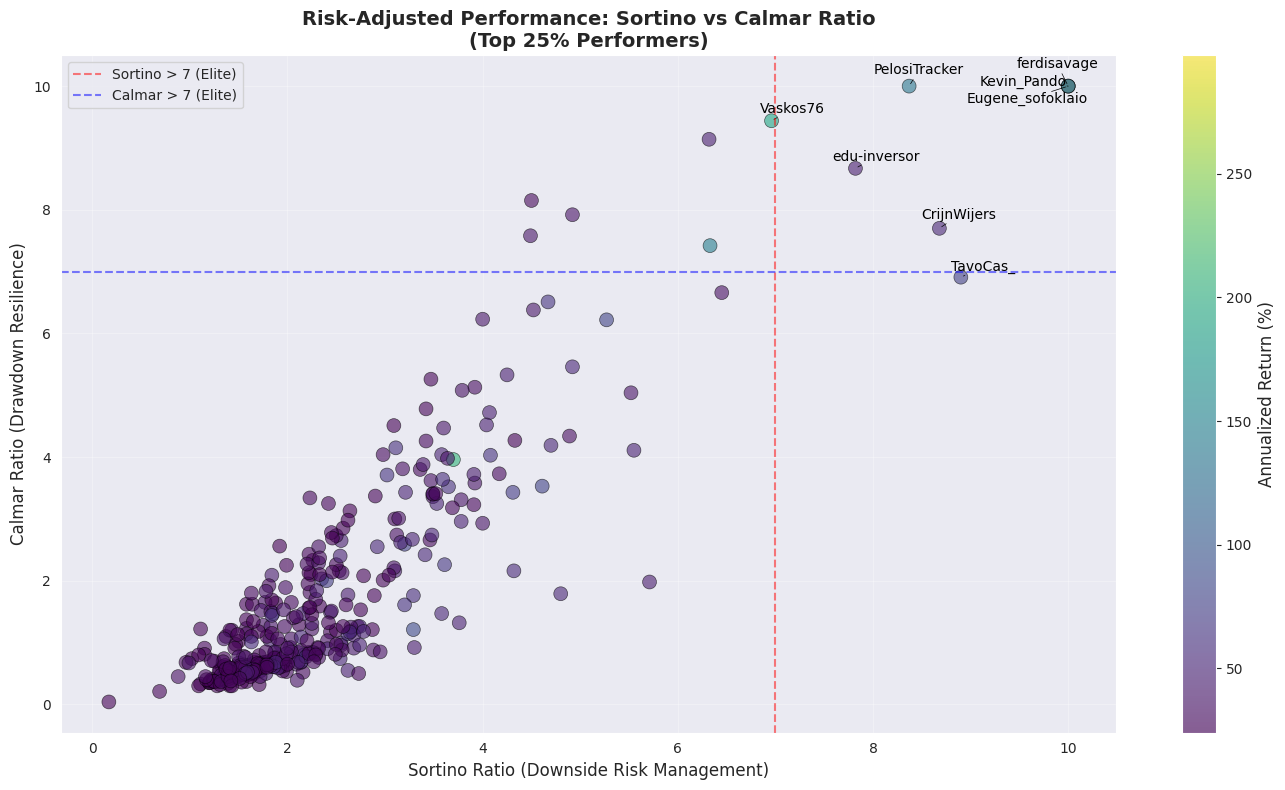
Figure 3: Scatter plot of Sortino vs Calmar for top 25% performers. Elite traders (both metrics > 7) appear in the upper right quadrant
The chart reveals several important insights:
-
Underestimated majority: Only 6 traders (1.6% of top 25%) meet both elite criteria (Sortino > 7 AND Calmar > 7)
-
Asymmetric distribution: Most traders cluster in the Sortino 2-4 and Calmar 0.5-3 range, indicating moderate-high risk
-
Exceptional outliers: Traders like
ferdisavage(Sortino 10, Calmar 10, Return 297.89%) represent statistically rare but real cases
The elite traders
Of the 1,500 traders analyzed, only 6 meet the strictest elite criteria (Sortino > 7 AND Calmar > 7):
| Trader | Annual Return | Sharpe | Sortino | Calmar | Beta | Score |
|---|---|---|---|---|---|---|
| ferdisavage | 297.89% | 3.75 | 10.00 | 10.00 | 0.92 | 10.00 |
| Kevin_Pando | 82.07% | 3.15 | 10.00 | 10.00 | 0.57 | 10.00 |
| Eugene_sofoklaio | 134.46% | 3.80 | 10.00 | 10.00 | 0.60 | 10.00 |
| PelosiTracker | 132.91% | 2.49 | 8.37 | 10.00 | 0.43 | 9.18 |
| edu-inversor | 46.32% | 1.00 | 7.82 | 8.67 | 0.81 | 8.25 |
| CrijnWijers | 52.14% | 2.41 | 8.68 | 7.70 | 0.88 | 8.19 |
Common characteristics of elite traders:
- Low/medium betas: Range 0.43-0.92, well below the top 25% average of 1.21
- Asymmetric returns: Sortino consistently > 2x the Sharpe ratio
- Exceptional resilience: Calmar ratios demonstrating recovery from drawdowns
- Diversity of approaches: Returns from 46% to 298%, all with controlled risk
Results and key findings
The analysis of over 1,500 traders revealed interesting findings:
-
Only 0.4% of all traders meet elite criteria (6 of 1,500), and only 1.6% of the top 25% performers, indicating that most assume excessive risks even among the best
-
The Sortino ratio is consistently 2.3x higher than Sharpe (mean 2.43 vs 1.05) for the top 25%, demonstrating asymmetric returns (occasional large gains, minimal losses)
-
Traders with Calmar < 1.0 represent 50% of the top 25%, suggesting that even successful traders experience significant drawdowns that could trigger panic selling
-
Elite traders have an average beta of 0.70, significantly lower than the top 25% average of 1.21, indicating market-neutral strategies or defensive positioning
-
The top 25% median (Sortino 2.0, Calmar 1.02) is well below the elite threshold (7.0), revealing a huge gap between good and exceptional traders
Technology stack
- Databricks (DBR 13.x): Unified analytics platform
- Apache Spark (3.4+): Distributed data processing
- Delta Lake (2.0+): Reliable data lake storage
- Python (3.9+): Primary development language
- BeautifulSoup4: HTML parsing
- PySpark & Pandas: Data analysis
- Matplotlib & Seaborn: Statistical visualizations
Next steps
The following improvements are planned:
- ML model to predict trader performance degradation based on historical patterns
- Interactive dashboard in Streamlit for dynamic trader comparison
- RESTful API for programmatic access to rankings and real-time metrics
- Alert system that notifies when metrics cross critical thresholds
- Backtesting framework to validate copy trading strategies before real investment
- Correlation analysis between traders for multi-trader portfolio optimization
Conclusions
This project demonstrates that risk-adjusted performance is fundamentally different from absolute performance. While social trading platforms highlight traders with 50-300% annual returns, only a tiny fraction (0.4%) combine these returns with sustainable risk profiles.
For investors, the lesson is clear: before copying a trader, analyze not only how much they earn, but how they earn it. A trader with 40% annually and Sortino 8.0 will probably provide a better experience (and long-term compound return) than one with 100% annually and Sortino 0.5.
The complete code is available in my GitHub repository.