Building Generative IA (GenAI) agents has shifted from being a novelty to a business necessity. However, once the “Hello World” of your RAG (Retrieval-Augmented Generation) is working, you face the real production challenge: How do I know what is really happening inside my agent?
Recently, Databricks has evolved Inference Tables, enabling the capture of payloads and performance metrics directly from Model Serving. However, when we need a deep analysis of the agent’s reasoning—its “thoughts,” document retrieval, and intermediate evaluations—MLflow Traces remain the richest source of truth for understanding the Chain of Thought and intermediate steps.
In this post, I share a reference architecture I developed to extract, process, and monitor GenAI agent traces, transforming nested JSONs into actionable quality metrics using Databricks Lakehouse Monitoring.
The Challenge: The “Black Box” of JSONs
Native MLflow tools are excellent for interactive debugging (trace by trace). But as Solution Architects and Data Scientists, we need to see the big picture: latency trends, drift in response quality, and token costs over time.
The workflow I propose consists of three stages:
- Ingestion: Batch extraction of traces from MLflow.
- Refinement: “Unpacking” complex metrics and accurate token counting.
- Monitoring: Activating Databricks Lakehouse Monitoring.
1. Ingestion: The Retroactivity Challenge
Databricks has made huge strides in integrating MLflow with Unity Catalog, allowing experiments in ideal scenarios to dump traces directly into system tables. However, in the real world, we run into an unavoidable barrier: retroactivity.
If the synchronization configuration wasn’t strictly set before starting the experiment—common in exploratory phases or legacy projects—those traces won’t magically materialize in your tables. They remain trapped in the MLflow server, inaccessible for massive SQL analysis. Therefore, although native synchronization is the future, programmatic extraction remains the only key to recovering that “lost history” and unifying all your development and production data in one place.
The following script bridges this gap using MlflowClient to “time travel,” recover those orphaned traces, and land them in a Delta table under our full control.
💻 Template: Trace Exporter (Backfill Strategy)
This script is the solution for downloading massive traces by managing API pagination, allowing you to backfill data from past experiments that the automatic system missed.
# -------------------------------------------------------------------------
# MLflow Trace Exporter Template
# Purpose: Fetch traces from an MLflow Experiment and save to a Delta Table
# -------------------------------------------------------------------------

import mlflow
from mlflow.tracking import MlflowClient
import pandas as pd
from pyspark.sql import SparkSession

spark = SparkSession.builder.getOrCreate()

# CONFIGURATION
# Replace with your specific Experiment ID and Target Table
EXPERIMENT_ID = "YOUR_EXPERIMENT_ID_HERE"
TARGET_TABLE = "catalog.schema.genai_raw_traces"
BATCH_SIZE = 100
SELECTED_COLUMNS = [
    "request_id", "request", "response", "start_time_ms",
    "execution_time_ms", "status", "tags"
    # Add other columns present in your traces
]

client = MlflowClient()
page_token = None

print(f"Starting export for Experiment {EXPERIMENT_ID}...")

while True:
    # 1. Fetch a batch of traces
    results = client.search_traces(
        experiment_ids=[EXPERIMENT_ID],
        max_results=BATCH_SIZE,
        order_by=["start_time DESC"],
        page_token=page_token
    )

    if not results:
        break

    # 2. Convert traces into a Pandas DataFrame
    # Note: trace.to_pandas_dataframe_row() flattens the top-level object
    batch_df = pd.DataFrame([trace.to_pandas_dataframe_row() for trace in results])

    # 3. Filter and select columns ensuring schema consistency
    # (Ensure columns exist in batch_df before selecting)
    available_cols = [c for c in SELECTED_COLUMNS if c in batch_df.columns]
    batch_df = batch_df[available_cols]

    # 4. Write to Delta
    spark_df = spark.createDataFrame(batch_df)

    print(f"Writing batch of {len(batch_df)} traces to {TARGET_TABLE}...")
    spark_df.write.format("delta").mode("append").option("mergeSchema", "true").saveAsTable(TARGET_TABLE)

    # 5. Handle Pagination
    if not results.token:
        break
    page_token = results.token

print("Export complete.")
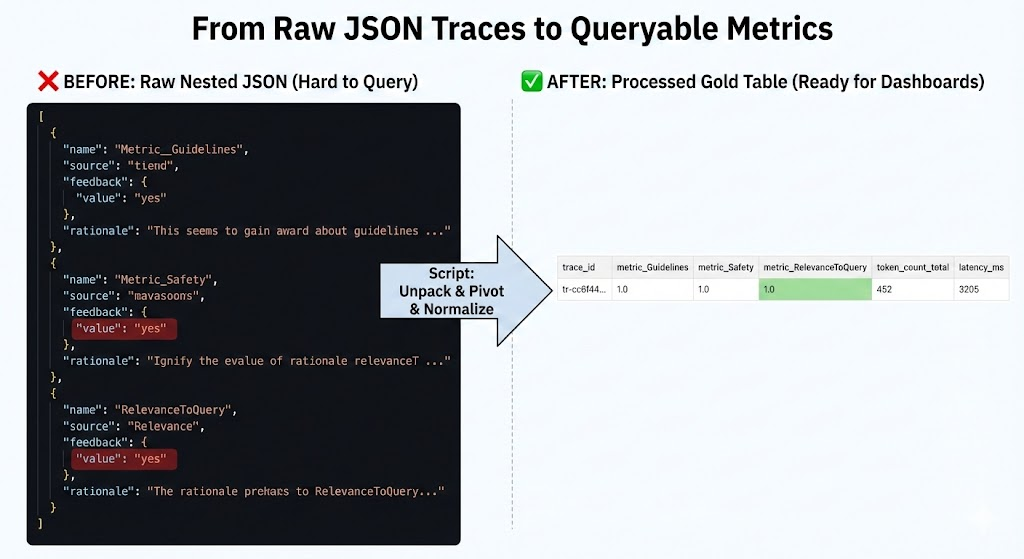
2. Processing: From JSON to Analytic Metrics
Raw traces often contain evaluation metrics (such as “faithfulness” or “answer_relevance”) nested in complex dictionaries or lists of JSONs within a column. To visualize this in SQL, we need to “unpack” these structures.
Additionally, I have incorporated tiktoken to calculate token consumption accurately, which is fundamental for cost control (FinOps).
💻 Template: Metrics Extractor & Token Counter
This script performs two key tasks:
- Uses
tiktokento calculate actual token usage for precise cost estimation (sincelen(string)does not reflect the real cost of LLMs). - Dynamically detects which metrics exist in the evaluation maps and creates a column for each one (Schema Evolution).
# -------------------------------------------------------------------------
# Trace Processing & Metrics Extraction Template
# Purpose: Clean raw traces, count tokens, and unpack nested metrics
# -------------------------------------------------------------------------

import json
import tiktoken
from pyspark.sql.functions import col, udf, pandas_udf, explode, map_keys
from pyspark.sql.types import IntegerType, MapType, StringType, FloatType
from typing import Dict

# CONFIGURATION
INPUT_TABLE = "catalog.schema.genai_raw_traces"
OUTPUT_TABLE = "catalog.schema.genai_processed_traces_gold"
# Select the encoding appropriate for your model (e.g., cl100k_base for GPT-4)
ENCODING_NAME = "cl100k_base"

# --- UDF 1: Token Counting ---
@pandas_udf(IntegerType())
def udf_count_tokens(texts: pd.Series) -> pd.Series:
    encoding = tiktoken.get_encoding(ENCODING_NAME)
    # Handle potential None/Null values safely
    return texts.apply(lambda x: len(encoding.encode(x)) if x else 0)

# --- UDF 2: Extract Metrics from Nested JSON/Maps ---
# Assumes 'assessments' is a list of dictionaries or a JSON string map
@udf(MapType(StringType(), FloatType()))
def udf_extract_metrics_map(assessments_str):
    if not assessments_str:
        return {}

    try:
        # Logic depends on how your metrics are stored.
        # Example: Parsing a list of dicts: [{"name": "relevance", "value": 0.9}, ...]
        data = json.loads(assessments_str) if isinstance(assessments_str, str) else assessments_str
        metrics_map = {}

        # Adapt this loop to your specific trace structure
        if isinstance(data, list):
            for item in data:
                name = item.get("name") or item.get("metric_name")
                value = item.get("value") or item.get("score")
                if name and value is not None:
                    # Convert boolean feedbacks (Yes/No) to float (1.0/0.0) if needed
                    if str(value).lower() == "yes": value = 1.0
                    elif str(value).lower() == "no": value = 0.0
                    metrics_map[name] = float(value)
        return metrics_map
    except Exception as e:
        return {}

# --- MAIN PIPELINE ---

df_raw = spark.table(INPUT_TABLE)

# 1. Calculate Tokens
df_processed = df_raw.withColumn("token_count_request", udf_count_tokens(col("request")))\
                     .withColumn("token_count_response", udf_count_tokens(col("response")))

# 2. Extract Metrics Map
# Assuming your traces have an 'assessments' or 'feedback' column
if "assessments" in df_processed.columns:
    df_processed = df_processed.withColumn("metrics_map", udf_extract_metrics_map(col("assessments")))

    # 3. Dynamic Schema Evolution (Unpacking the Map)
    # Identify all unique metric keys present in the data
    keys_df = df_processed.select(explode(map_keys(col("metrics_map")))).distinct()
    available_metrics = [row[0] for row in keys_df.collect()]

    print(f"Dynamic metrics found: {available_metrics}")

    # Promote each metric from the Map to a top-level column
    cols = [col(c) for c in df_processed.columns if c != 'metrics_map']
    for metric in available_metrics:
        cols.append(col("metrics_map").getItem(metric).alias(f"metric_{metric}"))

    df_final = df_processed.select(*cols)
else:
    df_final = df_processed

# 4. Save to Gold Table
print(f"Saving to {OUTPUT_TABLE}...")
df_final.write.format("delta").mode("overwrite").option("mergeSchema", "true").saveAsTable(OUTPUT_TABLE)
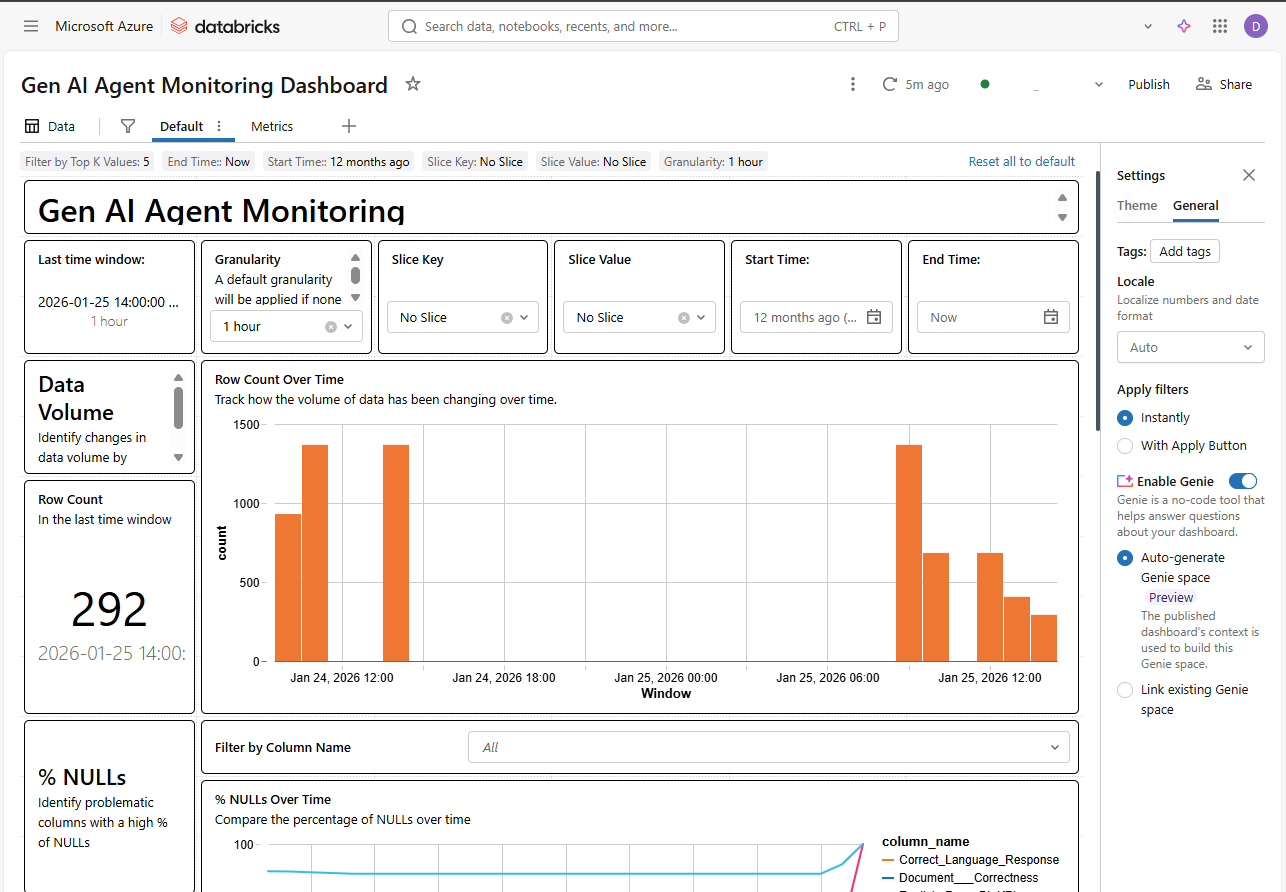
3. Monitoring: Automation with Databricks SDK
The final step is to avoid having to check this table manually. Using the Databricks SDK, we can programmatically deploy a “Quality Monitor.” This automatically generates a dashboard that tracks data drift and model quality over time.
💻 Template: Quality Monitor Creation
This script connects the processed table with the Databricks monitoring system.
# -------------------------------------------------------------------------
# Databricks Lakehouse Monitor Setup Template
# Purpose: Programmatically create a Quality Monitor for the Gold Table
# -------------------------------------------------------------------------

from databricks.sdk import WorkspaceClient
from databricks.sdk.service.catalog import MonitorTimeSeries

w = WorkspaceClient()

# CONFIGURATION
TABLE_NAME = "catalog.schema.genai_processed_traces_gold"
ASSETS_DIR = "/Workspace/Users/your_user@domain.com/genai_monitoring"
OUTPUT_SCHEMA = "catalog.schema" # Where metric tables are stored

print(f"Creating monitor for {TABLE_NAME}...")

try:
    w.quality_monitors.create(
        table_name=TABLE_NAME,
        assets_dir=ASSETS_DIR,
        output_schema_name=OUTPUT_SCHEMA,
        # Configure Time Series monitoring based on request timestamp
        time_series=MonitorTimeSeries(
            timestamp_col="start_time_ms", # Or your timestamp column
            granularities=["1 hour", "1 day"]
        )
    )
    print("Monitor created successfully! Check the 'Quality' tab in Unity Catalog.")
except Exception as e:
    print(f"Note: Monitor might already exist or error occurred: {e}")
Conclusion
Integrating MLflow Traces with the Unity Catalog data ecosystem allows us to move from anecdote (“the bot gave a wrong answer once”) to statistics (“the ‘faithfulness’ metric has dropped 5% in the last release”).
This approach gives us full control over the data, enabling us to cross-reference AI metrics with business data—something impossible when using siloed monitoring tools.